Dimensionality Reduction using Principal Component Analysis

I. Introduction to Principal Component Analysis
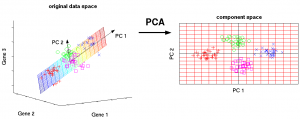
Principal component analysis (PCA) is a technique used for identification of a smaller number of uncorrelated variables known as principal components from a larger set of data. The technique is widely used to emphasize variation and capture strong patterns in a data set. Principal component analysis is considered a useful statistical method and used in fields such as image compression, face recognition, neuroscience and computer graphics.
II. Concepts of PCA
Principal component analysis helps make data easier to explore and visualize. It is a simple non-parametric technique for extracting information from complex and confusing data sets. Principal component analysis is focused on the maximum variance amount with the fewest number of principal components. One of the distinct advantages associated with the principal component analysis is that once patterns are found in the concerned data, compression of data is also supported.
Imagine that you are a nutritionist trying to explore the nutritional content of food. What is the best way to differentiate food items? By vitamin content? Protein levels? Or perhaps any other combinations? Well, there could be ‘n’ no. of features and selecting the one which really correlates to the output is complicated task. By reducing the dimensions/features we can actually use only the features which are really correlated to the data.
The need for Dimensionality Reduction:
- Large dimensions are difficult to train on, need more computational power and time.
- Visualization is not possible with very large dimensional data.
- Loading very high dimensional data can be an issue with limited storage space in-memory.
- It can be used to reduce the dimension of the features, potentially leading to better performance for the learning algorithm by removing redundant, obsolete and highly correlated features.
Knowing the variables that best differentiate your items has several uses:
- Visualization – Using the right variables to plot items will give more insights.
- Uncovering Clusters – With good visualizations, hidden categories or clusters could be identified. Among food items for instance, we may identify broad categories like meat and vegetables, as well as sub-categories such as types of vegetables.
III. Conclusion
Principal component analysis is widely used in many areas such as market research, social sciences and in industries where large data sets are used. The technique can also help in providing a lower-dimensional picture of the original data. Only minimal effort is needed in the case of principal component analysis for reducing a complex and confusing data set into a simplified useful information set.