Image Classification using k-means clustering algorithm
Introduction
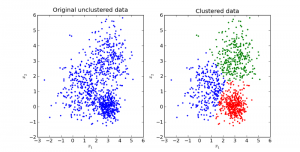
Clustering is one of the most common exploratory data analysis techniques that are used to obtain an intuition about the structure of the data. It is the task of identifying sub-groups in the data such that data points in the same sub-group (cluster) are very similar while data points in different clusters are very different. In other words, we try to find homogeneous clusters within the data such that data points in each cluster are as similar as possible, with respect to a similarity measure such as euclidean-based distance or correlation-based distance. The decision of which similarity measure to use is application-specific.
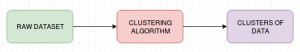
k-means clustering is an unsupervised learning technique that is used when we have unlabelled data. The main goal of this algorithm is to divide the data points in a data set into different categories or groups. The data points are grouped together based on their similarities. k-means tries to partition the data set into k-clusters using an objective function.
In layman term’s, imagine you have been given a data set consisting of purchasing patterns of customers in a mall and your task is to identify the HNI who can be given selective discounts or can be persuaded to purchase expensive items. By applying Clustering Methods, one can split the customers into varying categories using different parameters and find out those HNI and provide customised offers to them.
k-means clustering algorithm
- Choose the value of ‘k’, i.e no.of clusters that are to be formed for a given data set.
- Randomly select ‘k’ data points from the data set as the initial cluster centroids.
- For each data item in the data set, compute the distance between the data points and the cluster centroids.
- Assign the data points to the closest centroids and update the centroids by recomputing them with new data points.
- Repeat steps 3 and 4 for all the data points in the data set.
There could be some instances where we may not know the number of clusters. This can be resolved by using the elbow method, which produces the following graphical output:

From the above graph, we can infer that, at k=4, the graph reaches an optimal minimum value. The reason it is named as ‘elbow method’ is that the optimum number of clusters represent an elbow joint.
Image Classification using k-means clustering
Let’s understand k-means clustering with the help of an image classification use case. The steps involved in image classification are:
- The images that are to be classified are imported and converted into arrays.
- Clusters are created. The clusters appear in the resulting image, distinctly dividing the image into a number of parts.
- The number of clusters can be changed to visually validate the image with different colours and decide what closely matches with the required number of clusters.
- Once the clusters are formed, we can recreate the image with the cluster centres and labels to display the image with grouped patterns.
Conclusion
The k-means algorithm is one of the simplest algorithms and it serves as an introduction to clustering techniques. It is easy to understand and implement.