Customize Pentaho+ ETL and Data Fitness transformation for Job monitoring Using Pentaho cTools
Overview
Once you run an ETL process in Pentaho, there are certain tasks that you can execute to monitor the progress of the Pentaho ETL process. These processes are the barrier for entry for the data coming into the data mart or warehouse, and that means that this is a big point of failure.
It’s also a complex one, too, because many of the ETL processes deal with different data input formats, different data volumes, and so on. And if things go wrong with the step, then you have a situation where the data is either not loaded into the database, or it’s loaded incorrectly.
Say, for example, there’s a problem with an external source system and the data doesn’t get delivered. Or, perhaps data is imported twice. These scenarios result in incomplete and inaccurate data respectively. And so, while ETL issues may not result in downtime for operations, it does have an impact when data is used to make critical business decisions.
Many Database Management Systems offer ways to monitor the ETL processes, such as mechanisms to check on individual steps. But this covers only one aspect of it. What about problems with the delivery of the data from external systems? What about data that is incorrect? It might be a good idea to use a monitoring tool to expand the visibility of your Pentaho ETL processes.
Why job Monitoring essential?
- To know the status of your running and completed jobs.
- To improve the performance of your Pentaho ETL jobs.
- To debug the jobs easily in case of failure.
- Analysis of historic jobs for better efficiency.
- To know the statistics of your production environment like
- Total number of jobs running
- Total memory consumption
- Total time consumed
- Average downtime of the server
- The volume of data handled
We have many ETL job monitoring tools available in the market. Some of them are mentioned below.
- Informatica power center
- Microsoft SQL Server SSIS
- Oracle
- Pentaho CTools
- Apache Airflow
- Talend Open Studio
There are many other benefits when you monitor your ETL process. But here our objective is to see how it can be done using the Pentaho ETL job monitoring tool.
JOB MONITORING IN PENTAHO :
Pentaho Data Integration provides you with a tool for tracking the performance of individual steps in a transformation. By helping you identify the slowest step in the transformation, you can fine-tune and enhance the performance of your transformations.
Step performance monitoring: If you configured step performance monitoring, with database logging (optional), you can view the performance evolution graphs. Performance graphs provide you with a visual interpretation of how your transformation is processing. To enable database logging, enable the option to Enable step performance monitoring within the Transformation Properties / Monitoring dialog box.

Sniff Test: The Sniff Test displays data as it travels from one step to another in the stream. The Sniff Test is designed to be used as a supplement to logs so that you can debug complex situations.
Note: Applying a Sniff Test slows transformation run speed, so use with care.
To use this, complete these steps:
- Right-click a step in the transformation as it runs.
- Select Sniff Test During Execution. There are three options in this menu
- Sniff test input rows – Shows the data inputted into the step.
- Sniff test output rows – Shows the data outputted from the step.
- Sniff test error handling – Shows error handling data.
After you have selected an option, values in the data stream appear. You are also able to observe throughput.

USING DASHBOARD – Pentaho Ctool :
Another part of these Pentaho ETL processes is monitoring them via a dashboard. Once you’ve loaded that data, you’re going to be loading new data into that on a recurring basis. Nothing appeals to us more than a picture. Thus we choose the pictorial representation of our job process in the form of graphs, charts, statistics.
Pentaho solves that aspect with a tool called as “Ctools”. CTools are a set of community-driven tools which are installed as a stack on top of the Pentaho BA Server.
CTools has five main advantages:
- Based on open source technology.
- Uses popular web technologies, such as Ajax, HTML, and CSS3.
- Manages the components’ lifecycles and interactions between them.
- Separates the HTML design from the component definition.
- It allows for extensibility.
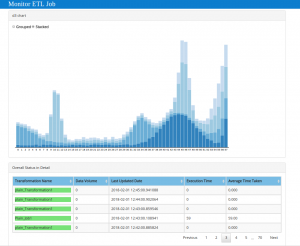
We can create our own customized job monitoring dashboard using Pentaho Ctool. You can find a sample of that in the below picture.

Let us dive into the features we use in it.
- ETL mainly comprise of ‘DATA’ so we can get the total number of jobs processed.
- At the technical level, we can get the success and failed jobs among the total value.
- Terminated job/transformations can also be viewed for the past 10 days.
- Time plays a vital role in monitoring ETL jobs. This can also be captured in your dashboard.
Another aspect of the dashboard is using the charts which are used for comparison. There can be many scenarios where this can be used. Some of them are explained in detail below.
- Total failed jobs over a period of time to analyze the debugging efficiency.
- Monthly data processing speed with respect to each product.
- Comparing the performance with the target against time and resource.
- The percentage of changes occurred in data over a certain period of time.

On the final note upon this blog, let’s make sure we monitor our ETL process with the best and efficient tool available. Prevent the tiresome and time-consuming work post issues and failures. Improve your data warehouse performance to the next level. Explore! Execute! Enjoy!